

Healthcare CRM Dashboard
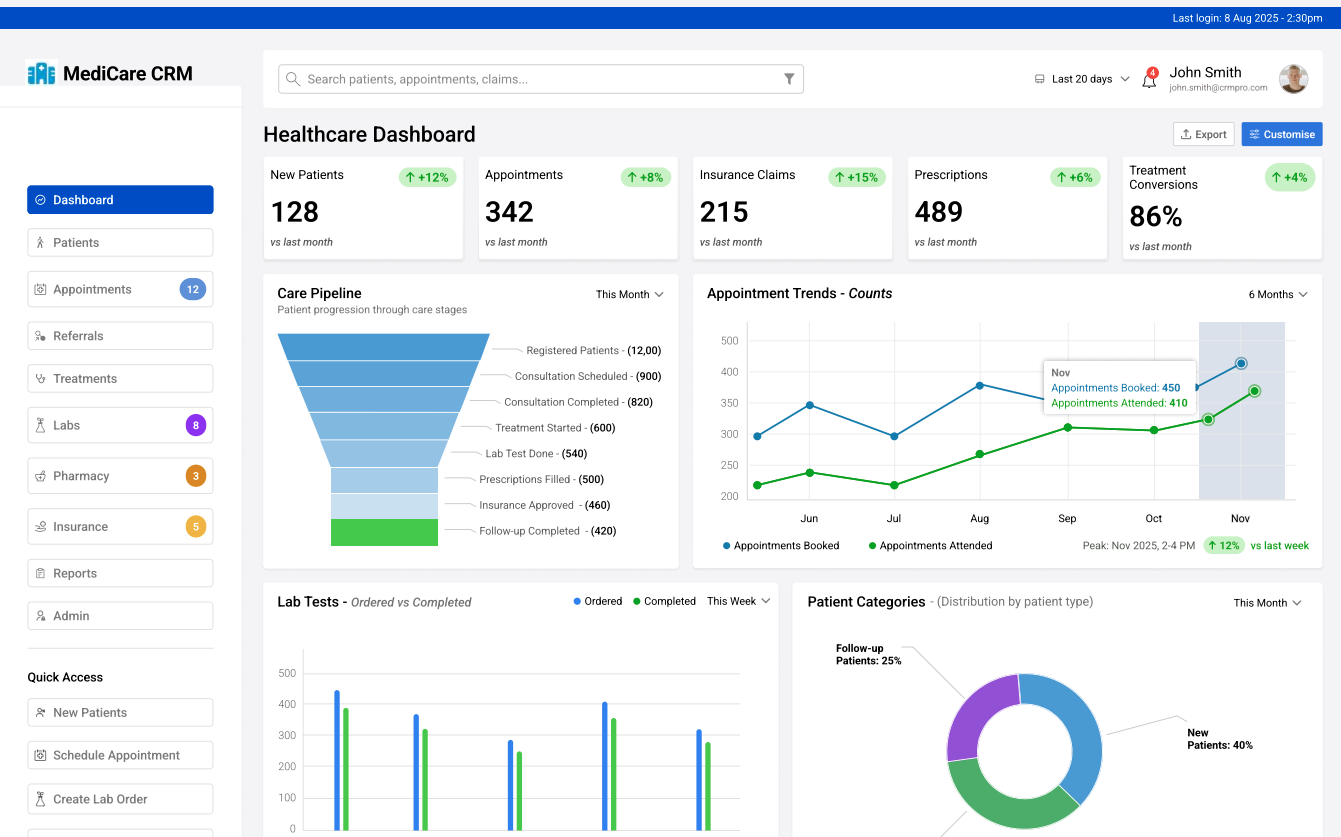
Enterprise dashboard unifying patients, appointments, labs, pharmacy, referrals, treatments and insurance for hospital and clinic staff.
Role
Lead Product Designer
Tools used
Dashboard UX, Design Systems, Healthcare, Figma
Platform tags
Enterprise Dashboard
Overview
Enterprise dashboard unifying patients, appointments, labs, pharmacy, referrals, treatments and insurance for hospital and clinic staff.
Problem statement
Hospital and clinic staff were working across disconnected views for patients, appointments, labs, pharmacy, and insurance — with no single hierarchy that served the different people who needed it. Executives, doctors, lab technicians, and pharmacy staff all needed different signals from the same underlying data, and a generic CRM template wasn't built to tell them apart.
Research & discovery
Audited how generic CRM dashboards handle healthcare data and found they treat clinical workflows like a standard sales pipeline — losing the terminology, urgency, and handoffs specific to patient care.
Mapped four distinct user types — executives, doctors, lab staff, and pharmacy — and the different slice of data each one actually needs to act on day to day.
Identified which UI patterns (KPI cards, care-stage funnels, timeline feeds) would need to repeat across future modules like insurance claims and lab orders, to avoid rebuilding from scratch each time.
Design decisions
A generic CRM template treats healthcare data like any other business pipeline.
Built a healthcare-specific design system — terminology, color coding, and iconography tailored to clinical workflows instead of adapted business-CRM patterns.
Executives, doctors, lab staff, and pharmacy teams all need different signals from the same dataset.
Defined role-based information hierarchy so KPIs, the care pipeline, and patient workflows surface differently depending on who's viewing the dashboard.
New modules like insurance claims or lab orders would otherwise need to be designed from scratch each time.
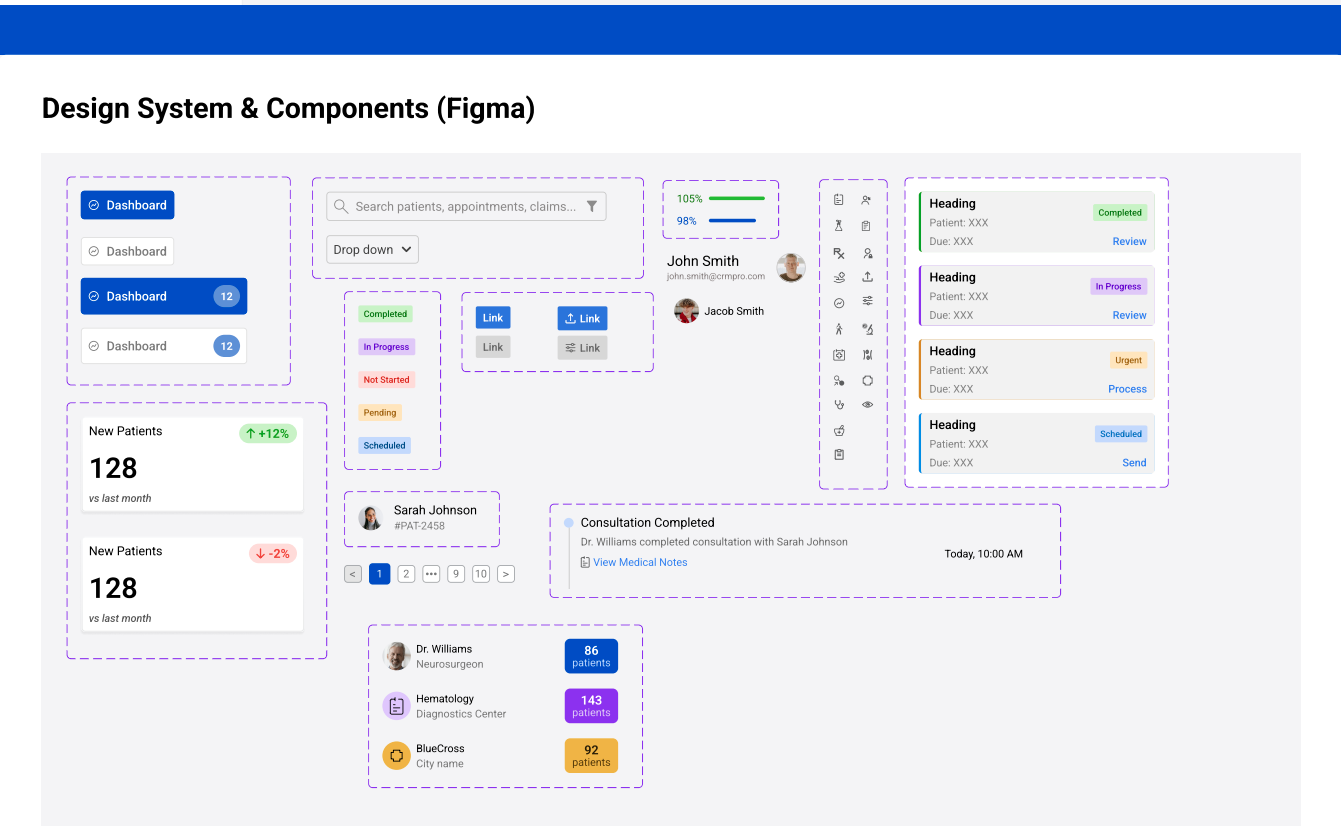
Built a reusable Figma component library — KPI cards, charts, tables, and timeline items — as variants, so new modules extend the existing system instead of starting over.
Visuals
Complete case study
Want the full breakdown?
This page shows a preview of the case study. For the complete write-up — additional screens, detailed process documentation, and outcomes — request access below.
Outcome / impact
Outcome
A scalable design system and clear, role-based information hierarchy — built once as reusable Figma components so the dashboard can extend to new modules like insurance claims or lab orders without redesigning core patterns.
Focus
Dashboard UX · Design Systems · Healthcare · Figma